Applied AI / 2024 — 2025
Market Analysis & Financial Insights
Economic indicators, sentiment features and model comparison.
01 / THE PROBLEM
Finding signal in context.
Economic time series arrive at different frequencies and describe different aspects of the market. This project explores how to align those indicators, inspect their relationships and compare regression approaches.
My contribution
Project contributorI contributed to this market-analysis project, which brings together data preparation, correlation analysis and a Streamlit interface for comparing inflation-regression models.
02 / TECHNICAL APPROACH
Inside the
implementation.
- 01
Notebooks prepare GDP, CPI, unemployment, treasury and bond yields, exchange rates and interest-rate data. A Sentiment column is included in the correlation analysis.
- 02
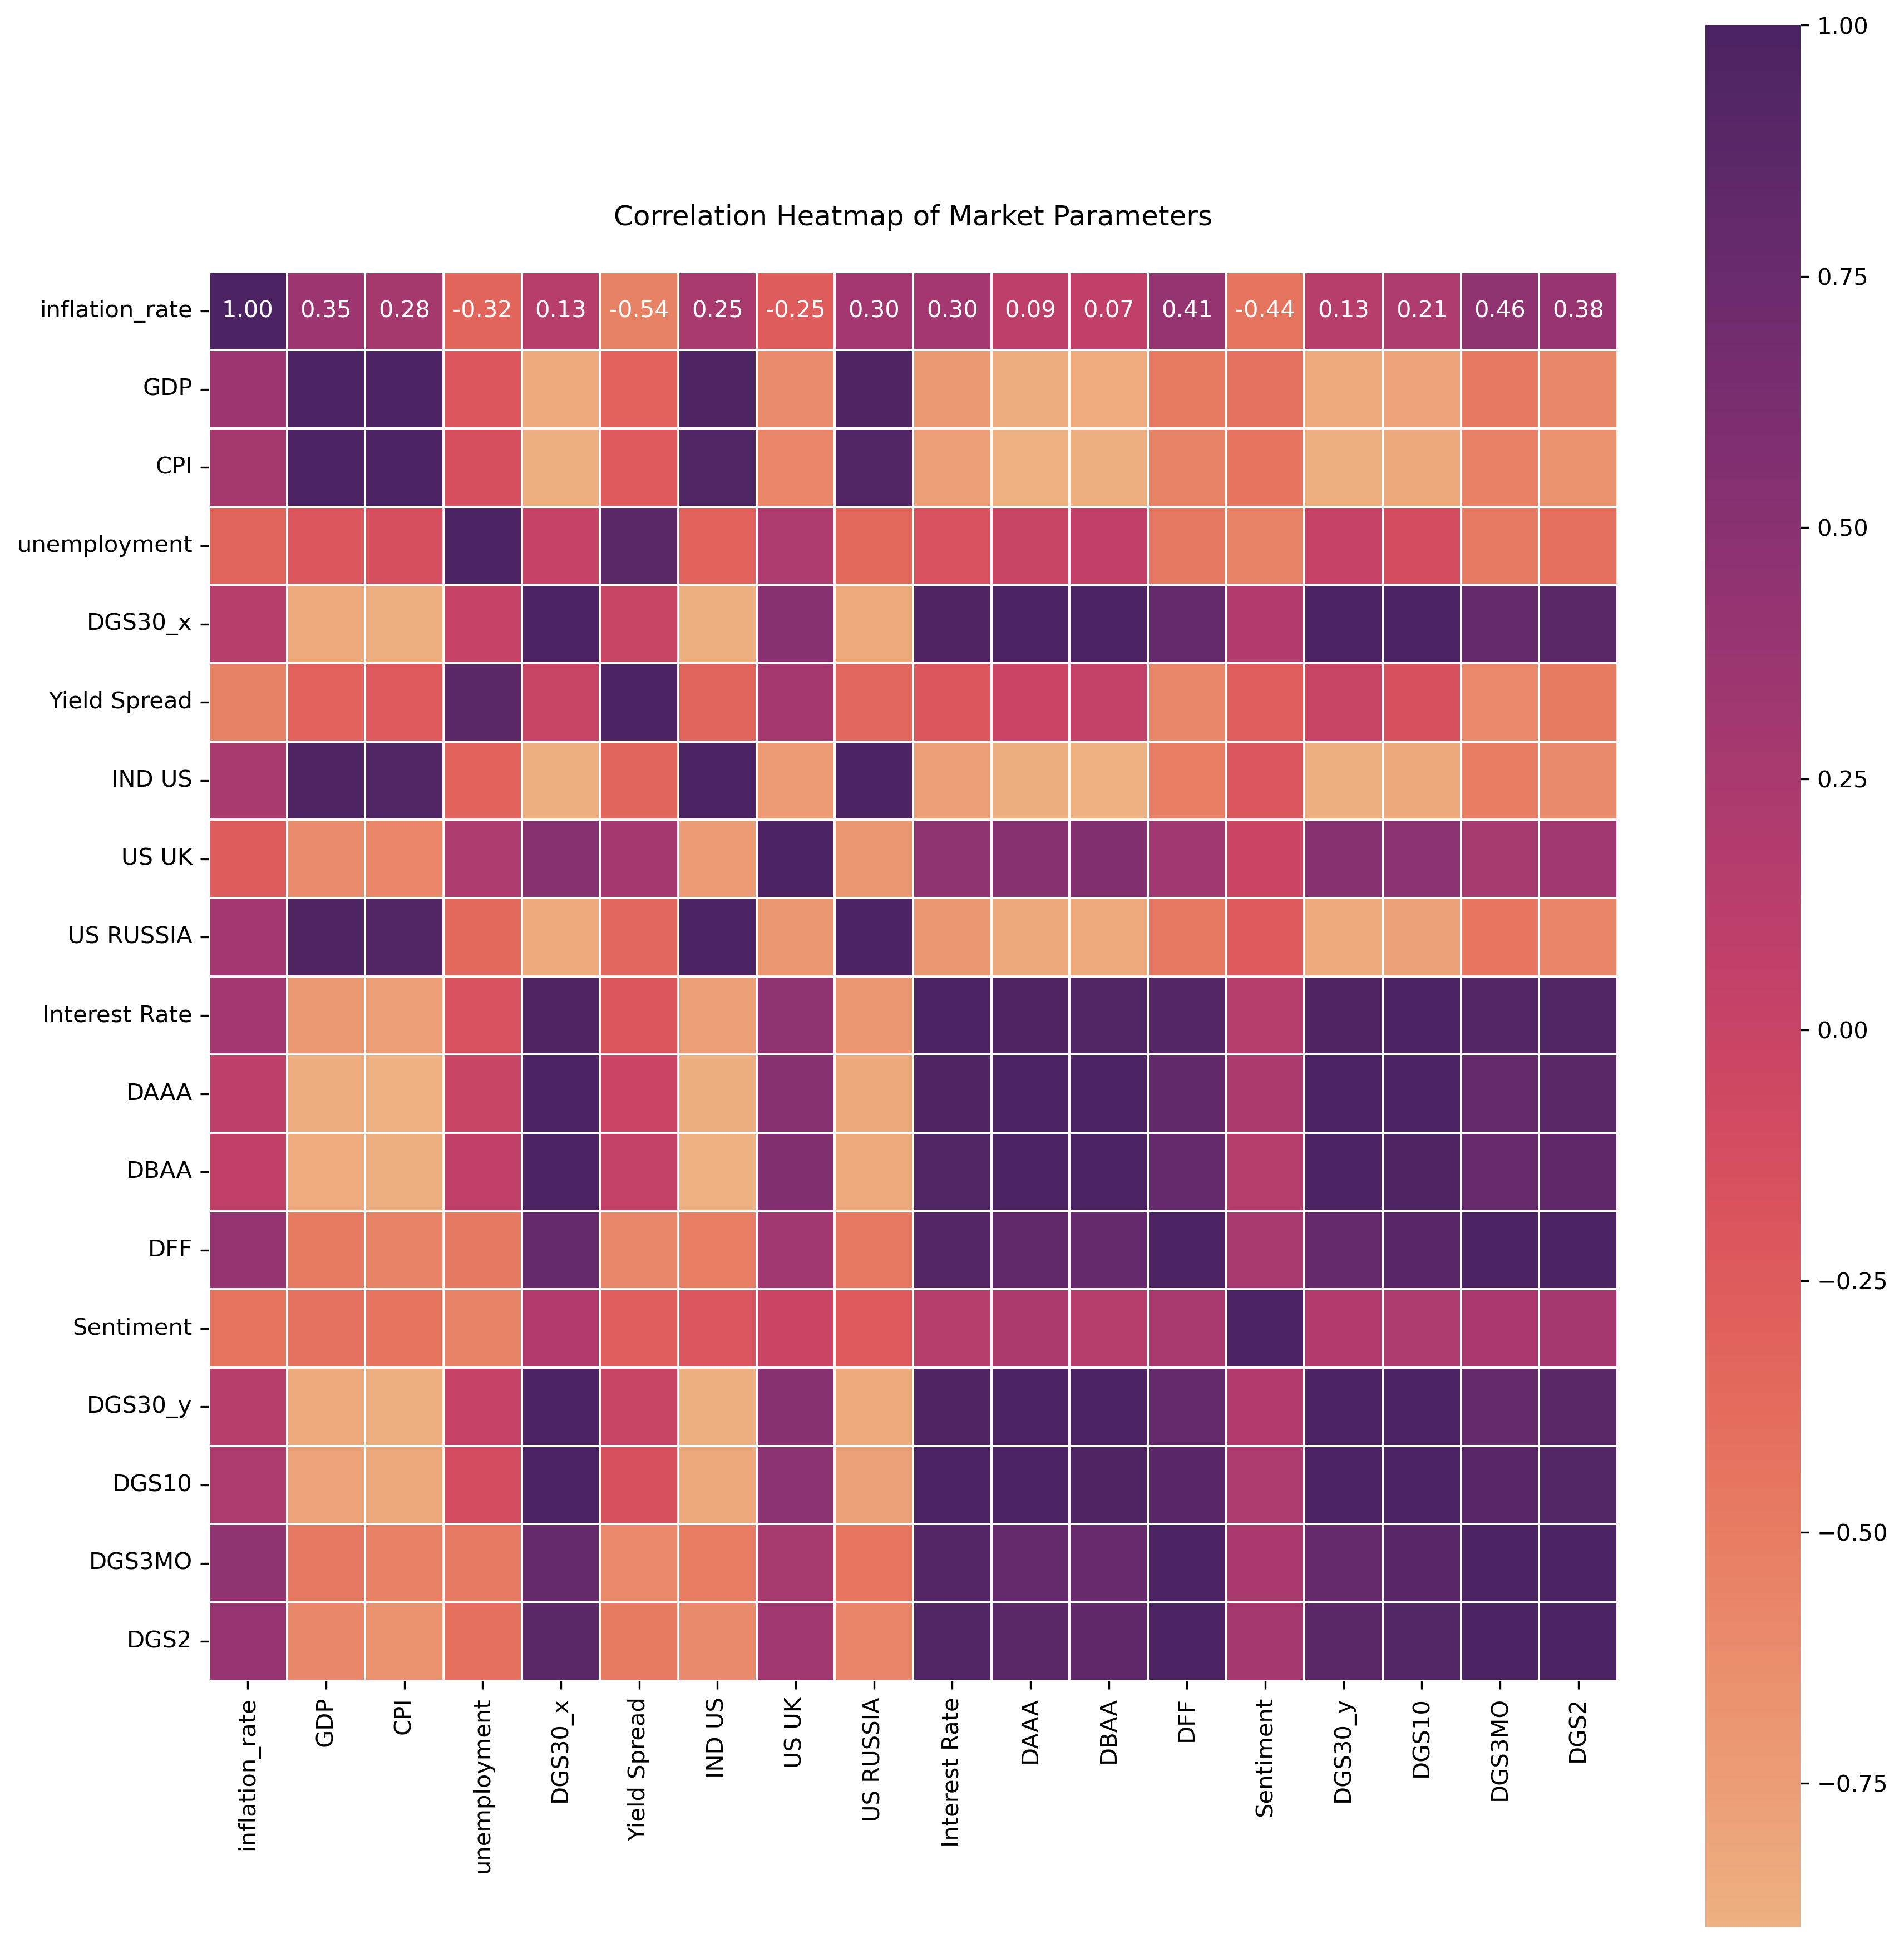
Date parsing, merges, interpolation and an experimental Fourier interpolation step align series. Saved correlation plots make relationships inspectable.
- 03
The Streamlit source offers Random Forest, XGBoost, LSTM, a dense neural network and Support Vector Regression to predict inflation_rate from numeric features.
- 04
The evaluation code computes MAE, MSE, RMSE and R². It standardizes features before a random split, which needs correction before making reliable time-series generalization claims.
03 / SYSTEM ARCHITECTURE
Follow the signal.
Select a stage to explore
how the system works.
Economic series
GDP, CPI, unemployment, yields, exchange rates, interest rates and a pre-existing Sentiment feature appear in the notebooks.
04 / SAVED ANALYSIS
The relationships, visible.
A saved notebook visualization. No fresh model inference or headline sentiment prediction is performed.
05 / RESULTS & OUTCOMES
What the work delivers.
The workflow compares five regression approaches and reports MAE, MSE, RMSE and R². The correlation heatmap helps explore relationships between 18 variables; it does not establish causation. Reliable predictive performance still needs chronological validation.
Scope & limitations
- The exact processed training CSV referenced by the Streamlit app is not present in the public tree and the path is machine-specific.
- The origin and scoring model of the Sentiment column are not verified. This site does not offer a headline sentiment classifier.
- No live inference is connected. This is an educational analysis project, not investment advice or a trading system.
06 / ENGINEERING DECISIONS
The interesting
constraints.
Aligning different time scales
The notebooks merge and interpolate economic series. Interpolation creates estimates, not new independently observed hourly data.
Evaluation can mislead
Random splits and fitting the scaler before splitting can leak information. Chronological validation and train-only preprocessing are necessary next steps.
A credible prediction starts with the data timeline and a defensible evaluation split.
07 / BUILDING BLOCKS
Tools with
a purpose.
- Pandas / NumPy
- Series preparation and analysis
- Scikit-learn / XGBoost
- Regression comparison
- TensorFlow / Keras
- Neural-network experiments
- Streamlit / Matplotlib
- Exploration and visual reporting
Go to the source
NEXT PROJECT / 04